Tingyun BPI
Analyze business data with non-intrusion
Tingyun BPI allows you to analyze business data in real time in a non-intrusive manner. It can associate user-side performance data with server-side performance data, and associate IT resource performance with business availability, so as to you can optimize the performance of business systems easily.
The system is associated with the business
Measure the profit and loss relationship
between IT operating status and business indicators Measure the profit and loss relationship between IT operating status and business indicators
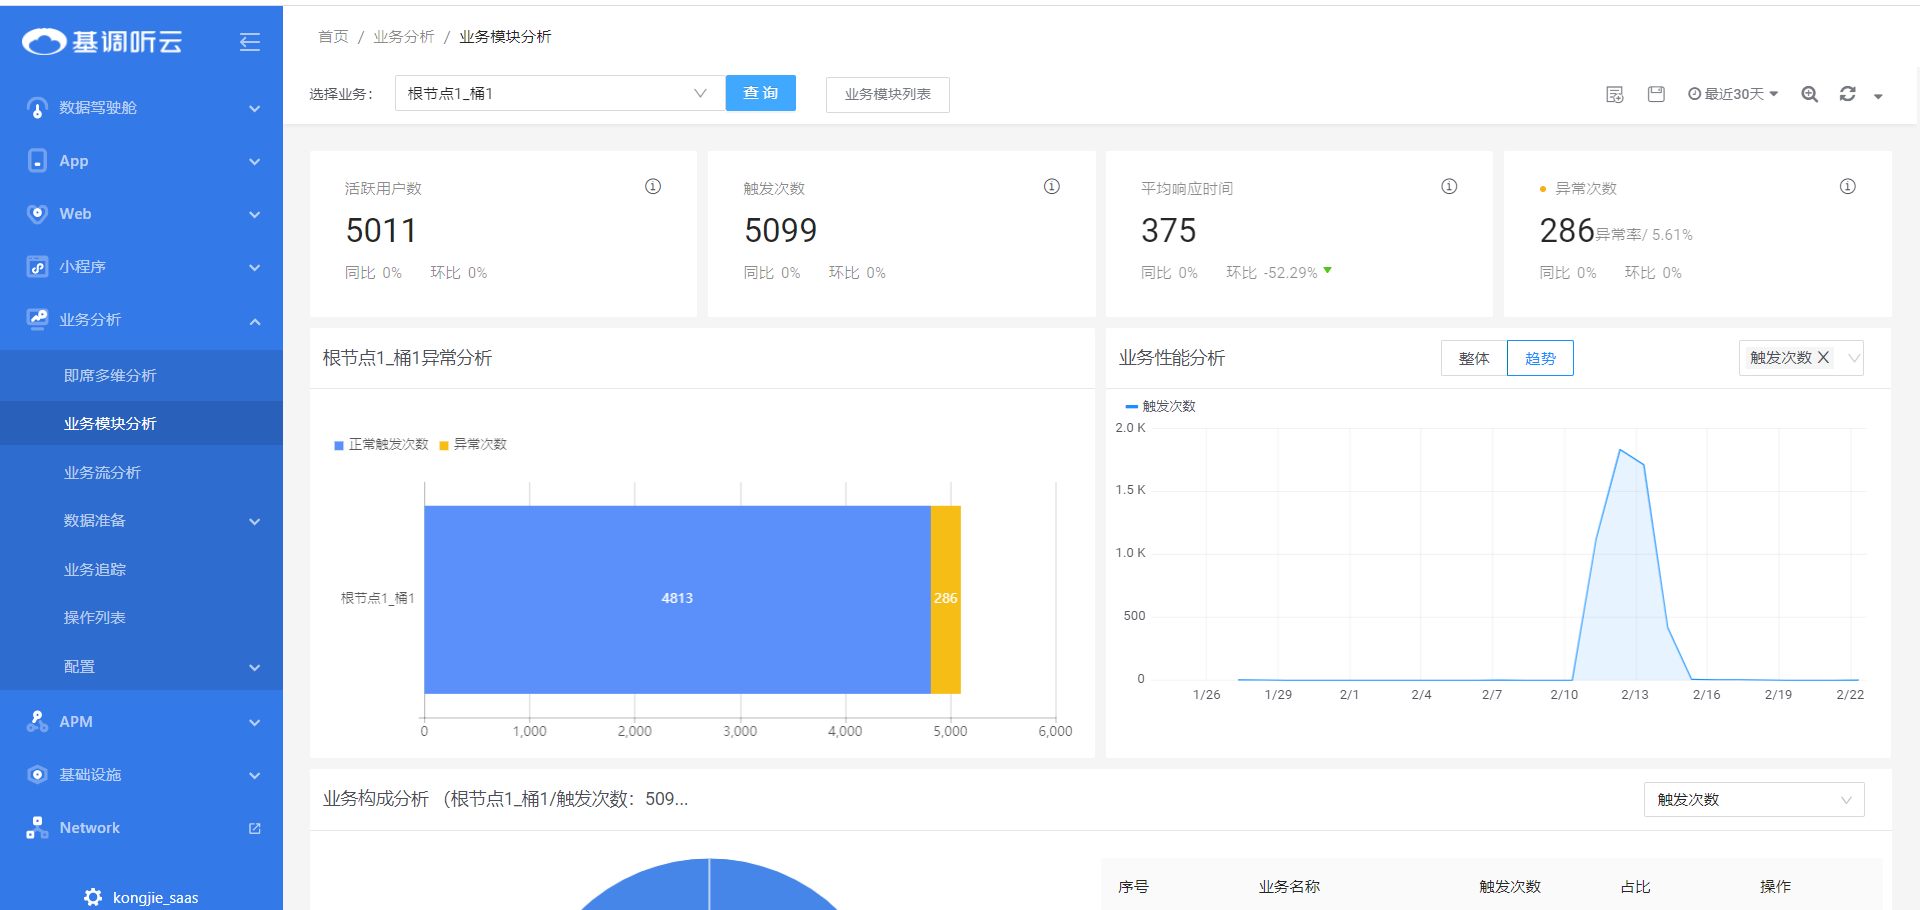
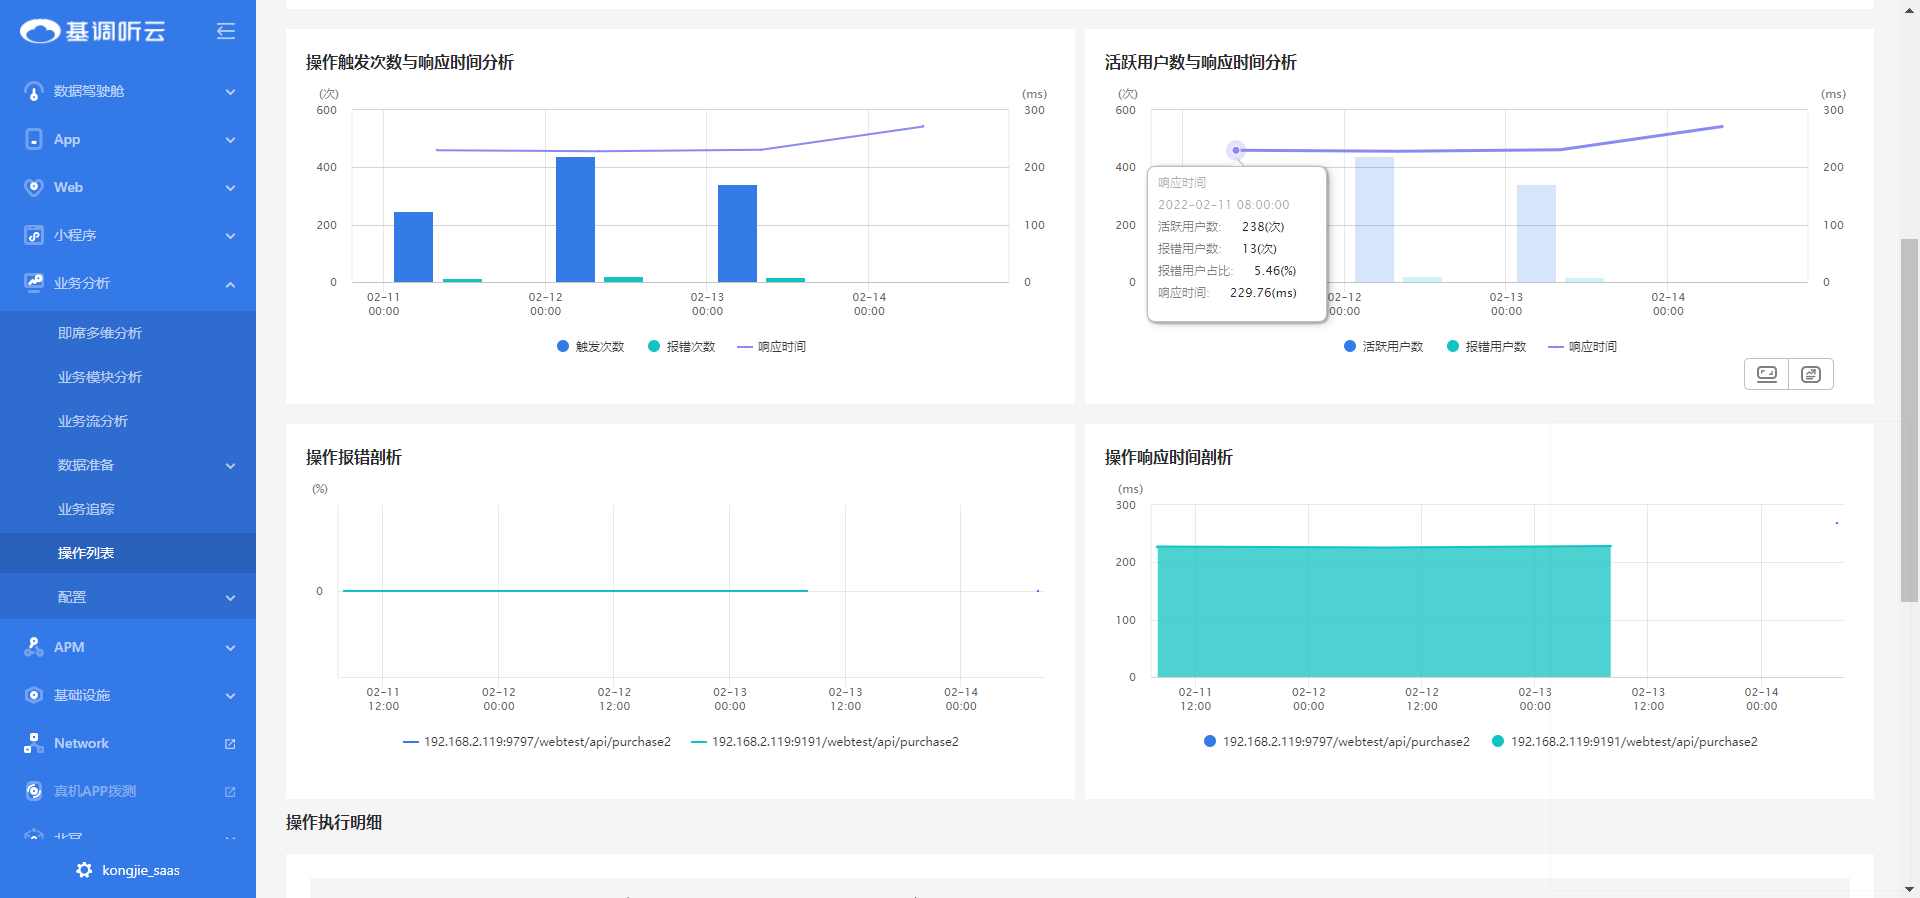
Tingyun Business Analysis effectively correlates back-end application performance data, front-end real user experience data, and key business indicator data, observes the business gains and losses brought by different user experiences from the business dimension at any time, and promotes business innovation and IT performance optimization in a timely manner.
Metric management
Flexible and efficient business indicator analysis
Flexible and efficient business indicator analysis
Tingyun Service Analysis realizes flexible custom business indicator configuration function, which can be used without the need to develop buried points, flexibly and quickly realize the measurement analysis and visualization of business indicators, and associate business indicators with application performance data and user experience data, so as to gain insight into whether business fluctuations are affected by application performance and user experience at any time.

Business restore
100% restoration of the business site, 100% restoration of the timely traceability
of the business site, and timely traceability
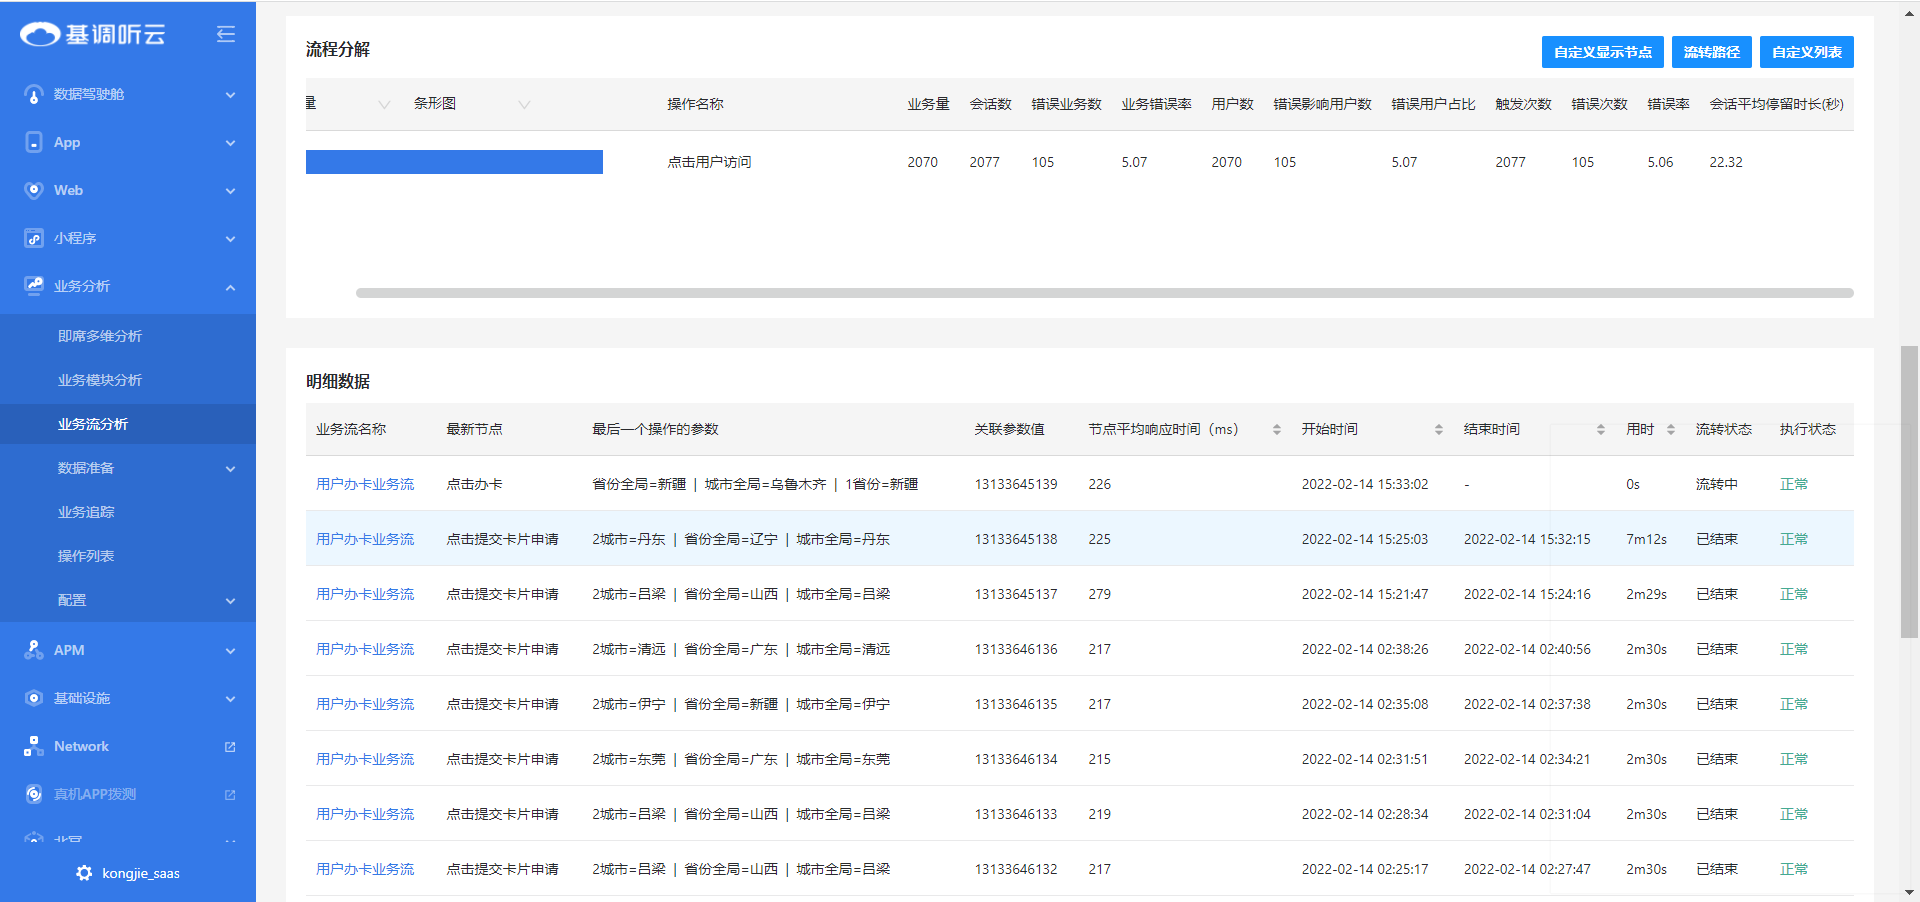
The Tingyun O&M monitoring platform supports multi-dimensional search and filtering of single services/individual users, quickly restores the status information during service execution (including the client’s interaction events, page data, request data, and all parameter information of the server-side transaction call chain), and restores the business execution process in a full-stack manner, helping users quickly troubleshoot and locate business problems.
Process management
Business Process Effectiveness Management
Business Process Effectiveness Management
Tingyun Business Analytics provides a series of performance monitoring metrics for the operation of the business process itself (such as: the average time consumption of the entire process, the average time consumption between any two steps, the current flow to a certain step and the completed business volume, etc.) to measure the business process performance, and measure the business process efficiency by the application system performance indicators that process the business process (such as error reporting rate, average execution time, etc.). Helps you manage business process effectiveness from multiple levels such as business flow and system operation.
