Tingyun VisBoard
Improve data perspective through multi-source data visualization analysis
Improve data perspective ability through multi-source data visualization analysis
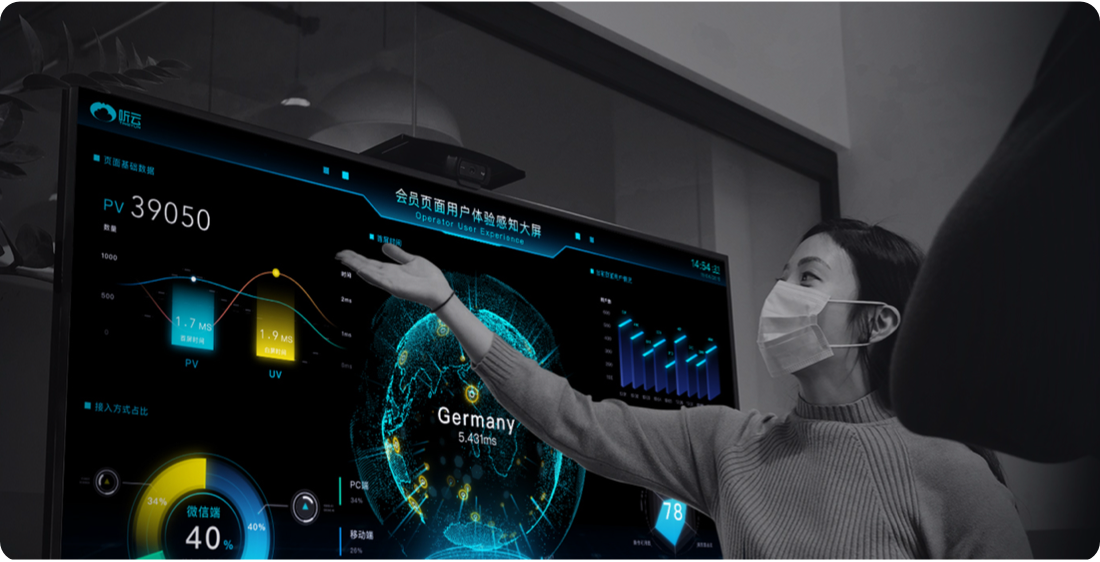
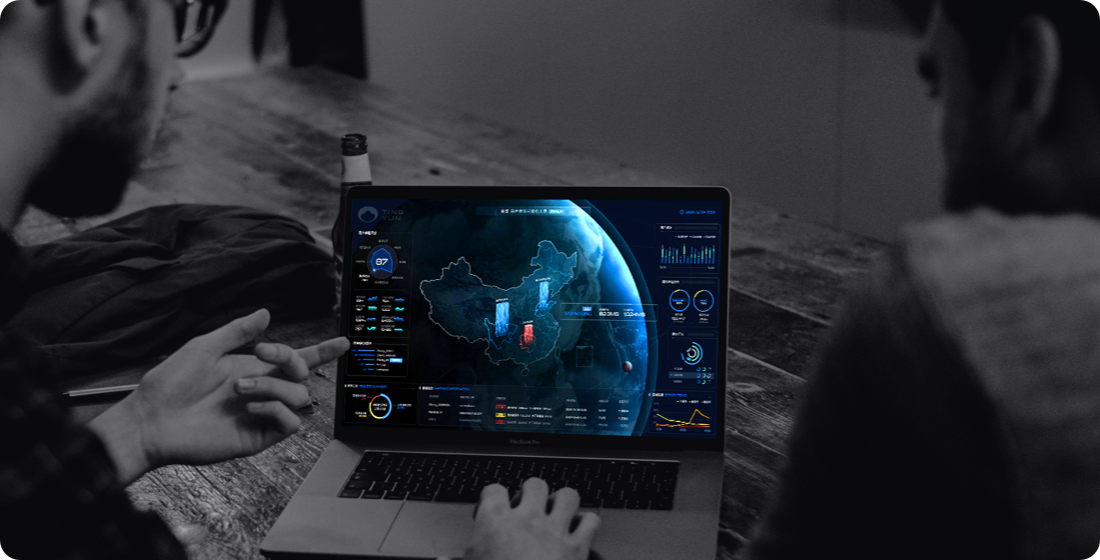
Tingyun VisBoard can ingest data from multiple sources, providing a unified display of metric data, tracing data and log data, helping enterprises improve the observability and data perspective ability of the system, in order to assist you make business decisions.

Digital transformation
Assist enterprises in digital transformation, and the visualization ability
to meet the business perspectives of different scenarios helps enterprises to digitally transform and meet the visualization capabilities of business perspectives in different scenarios
Help enterprise managers, business management and other roles to quickly realize the business situation can be felt and visualized, assist in judging trends and decision responses, and quickly build a visual monitoring system.
Real-time data display
Overview of global daily performance data performance, real-world monitoring of O&M status
Overview of global daily performance data performance, real-world monitoring of O&M status
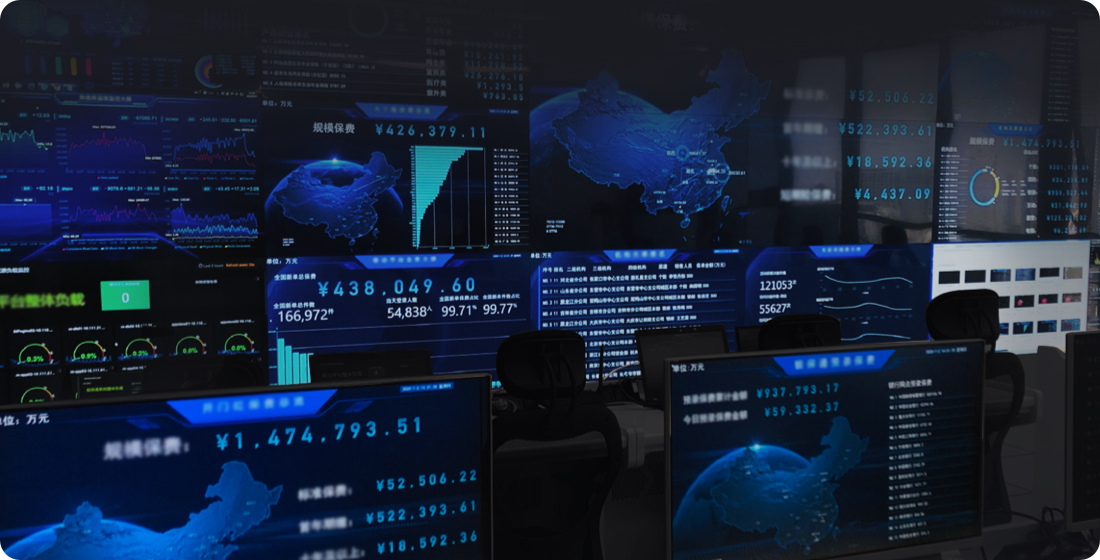
Provide a complete data visualization monitoring platform for enterprise users, display the status of various IT indicators in real time, and locate problem bottlenecks with one click


Activity Guarantee
Important activities guarantee Important
activities guarantee
The Tingyun data visualization monitoring system can guarantee the important activities held by the enterprise, monitor the service operation status of the backend, the business of the front end, and the indicators in the activities, and customize the exclusive operation guarantee screen


