Tingyun Web

Monitoring and analysis of web front-end performance and user experience

Monitor and analyze Web application performance and user experience

Tingyun Web enables you to monitor and analyze Web application performance, quantify user experience metrics, collect JS errors of Web pages and network request errors. You can quickly locate web application performance problems and make performance optimization.
Free Trial

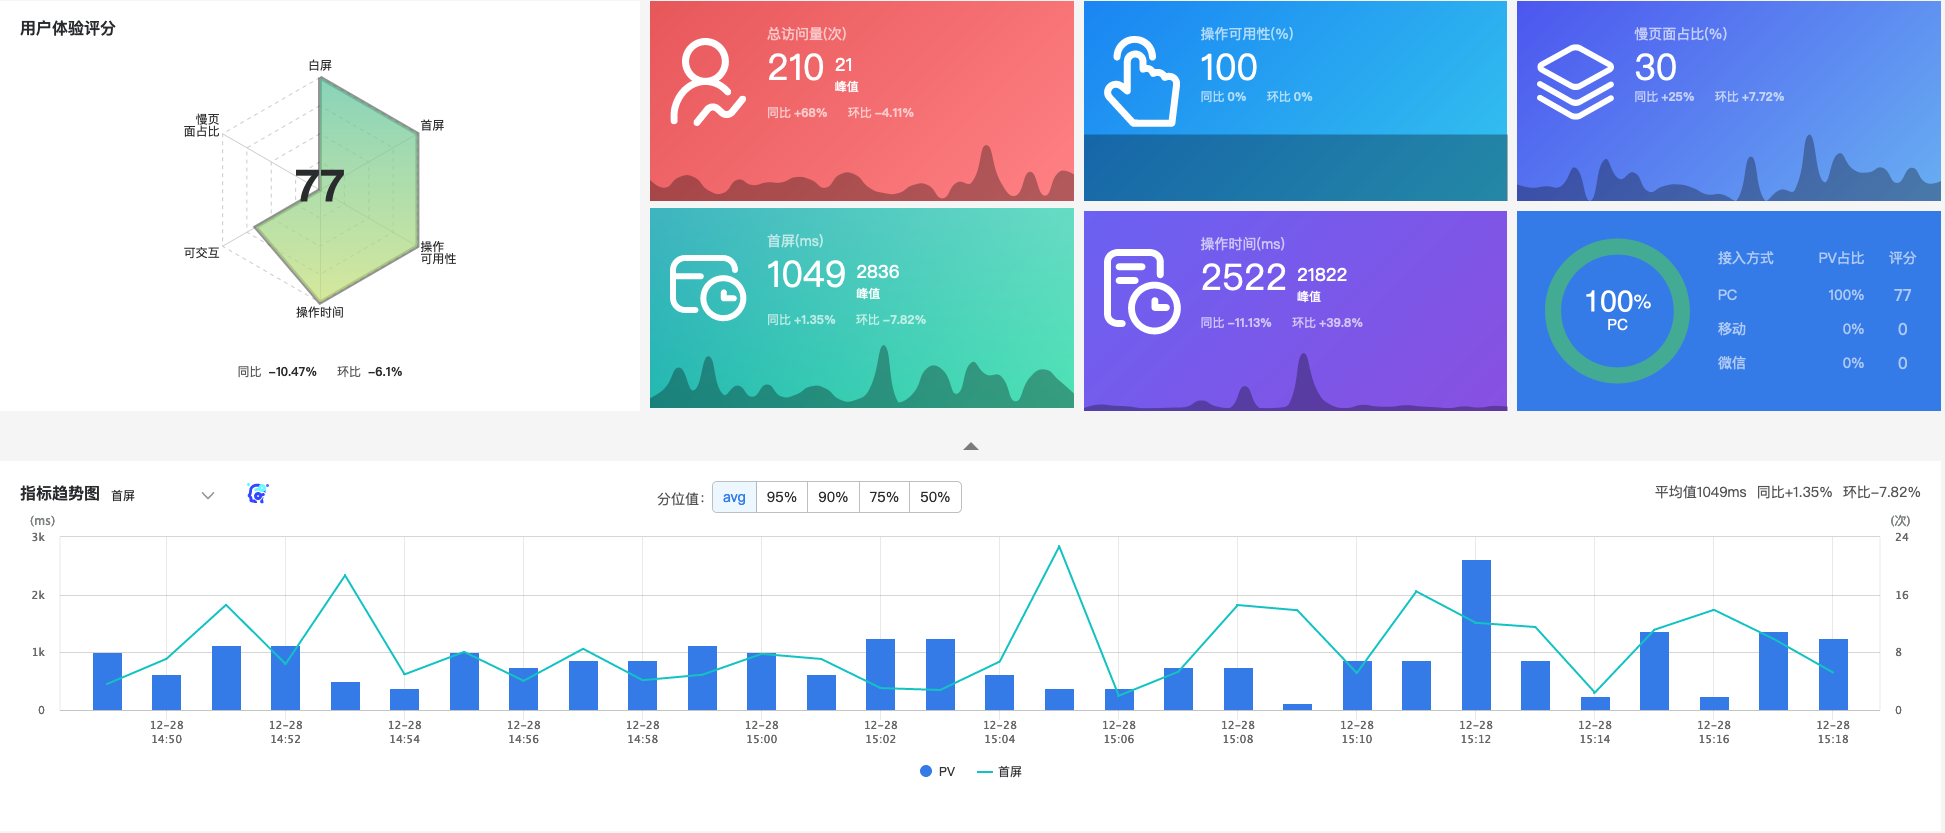
User Experience Rating

Based on the core indicators such as white screen, front screen, interactive, operation time, slow page proportion, and operation availability that can be perceived by real users of the website, multi-dimensional intelligent scoring is carried out to digitally measure the real user experience.

Page user experience analysis

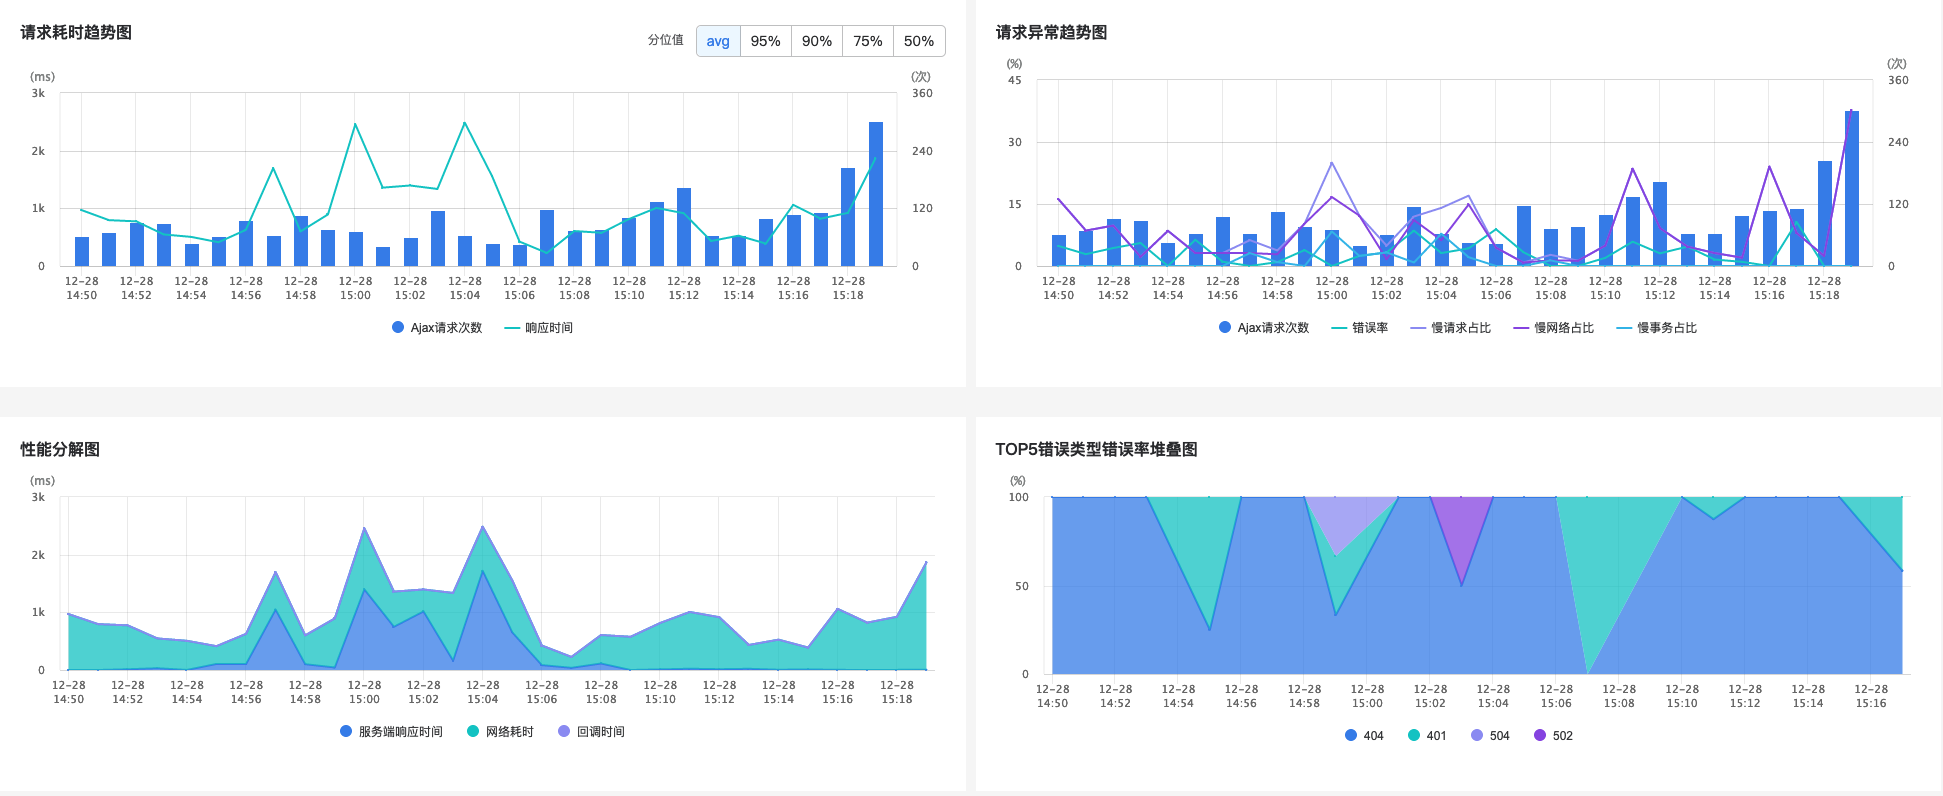
Monitor the user experience indicators such as white screen, front screen, and interactive that the real user of the website can perceive, and guide the optimization and improvement of the user experience from 13 technical performance indicator dimensions such as server-side response time, network latency, and DOM parsing.

JS error monitoring

Monitor the JS error rate trend, and at the same time, you can locate the page or script URL where the JS error is located, the error column, stack, and other information at the code level, and also support SourceMap, which can restore and compress the JS error code column.

Browser monitoring

Statistics on the average page load time and throughput rate of different versions of browsers and device types, providing users with multi-platform browser performance analysis, and effectively improving the compatibility of websites under different browsers.

Regional operator analysis

It can analyze the key network performance indicators in different regions (including countries, provinces, cities), different operators and access methods (including 2G/3G/4G/WiFi) to quickly locate network problems.

Module user experience analysis

Support custom selection of domain name/URL combination into module from any embedded coded application, monitor the user experience of the module, and realize the convenient and fast customization of the page user experience under a certain business, a domain name, a subdomain, or a functional module.

Operation analysis

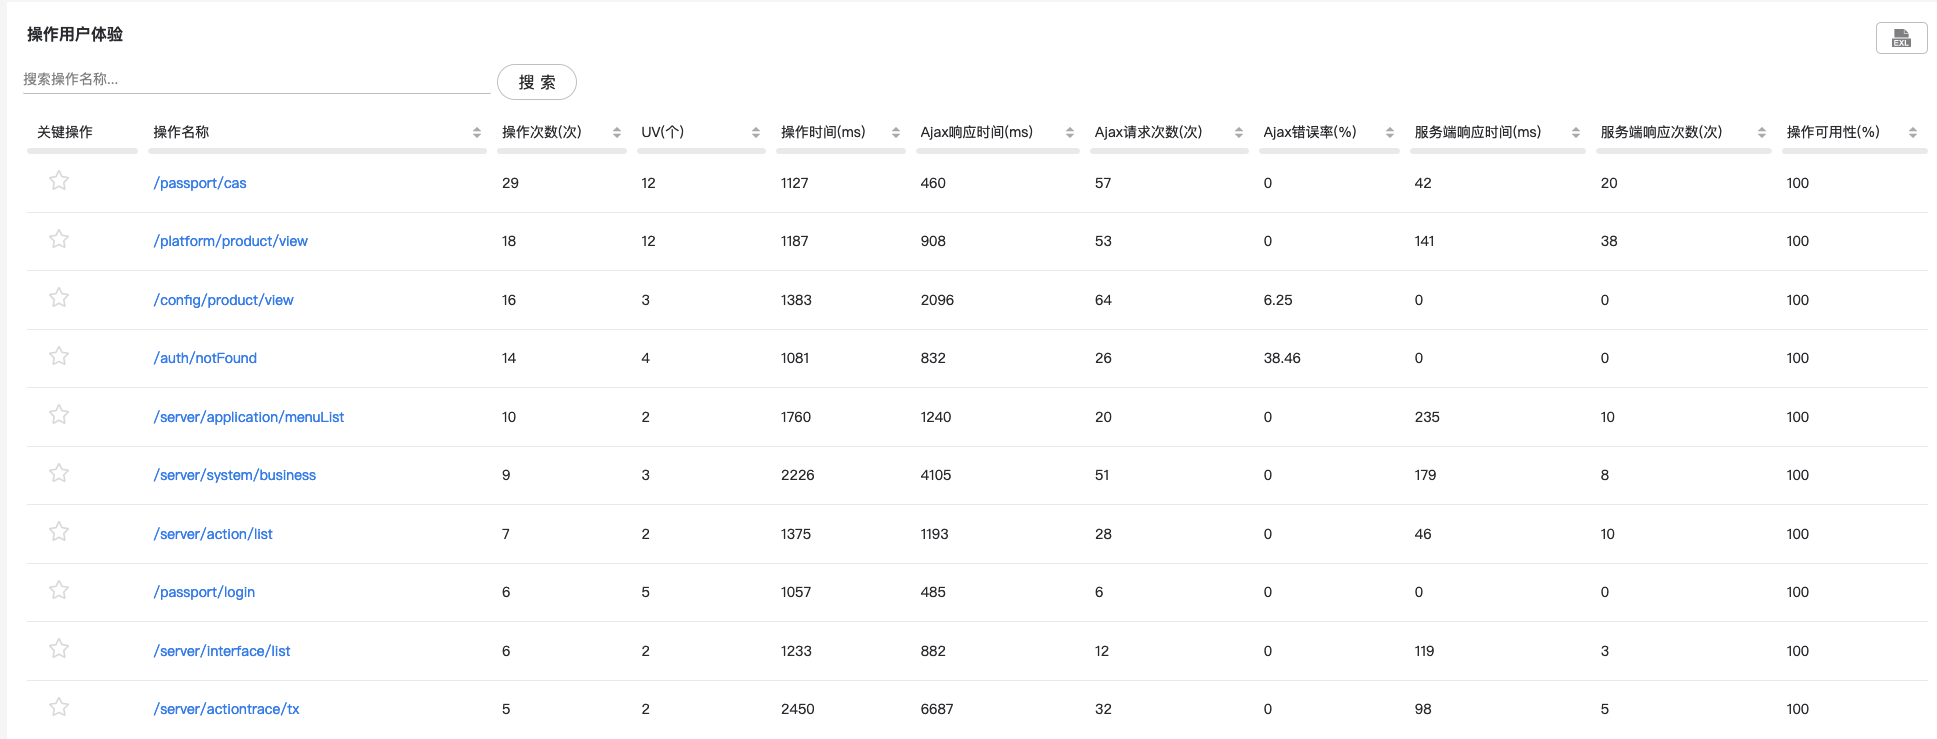
Say goodbye to cumbersome buried points, automatically identify website operation click events, monitor the number of operations, response time and availability, and realize the monitoring of user operation processes and ensure the stable operation of business.

User tracking

Record the slow pages, slow operations, and single-sample records of failed operations visited by all users, and when users complain, they can quickly retrieve their access records through their user names, quickly locate and reproduce, and improve the quality of customer service.

Session tracking

Record the session duration and access track of each session of each user, including each page view and operation click event, and analyze the user’s operation flow and location problems.

User experience

Improve the user experience

Improve the user experience

Through real user monitoring, real-time understanding of the real feelings of users visiting web pages, by reducing errors, loading on demand and other ways to improve the user’s experience of browsing the page, while key indicators can be formulated based on industry standards as performance appraisal standards.

Error analysis

Dive deeper into JS errors

Dive deeper into JS errors

Don’t let problems in your code irritate your customers. Through JS error analysis, quickly find and repair the most important JS errors, ensure that JS is executed efficiently, and alleviate overall website performance issues.

Easy to use

Support for any SPA framework works out of the box

Support for any SPA framework works out of the box

Whether you’re using Angular, React.js Ember, Backbone.js or a custom framework, Keynote Listening Cloud Web’s SPA monitoring helps you instantly monitor and view asynchronous page elements like JS and AJAX calls.

AJAX monitoring

Understand your AJAX calls

Understand your AJAX calls

Review each data call and routing change to see how your AJAX performance affects the user experience. It can analyze the most resource-intensive AJAX requests at the site according to response time, callback time, throughput or data transmission, and support full link tracing to locate the root cause of the server-side problem with one click.